An analysis of the frequency with which customers choose Powerball numbers
I told you that I got a little obsessed with the Powerball lotto last week, when I broke down the behavioral economics behind my decision to join an office pool. Well the obsession continued, as I searched for an optimal strategy for playing the lottery. Plus, writing about the Powerball again allows me pull out more "ball"-related double entendres.Optimal strategy, isn't it a lottery? That's a reasonable question, as the whole lottery just comes down to picking some random numbers. But, when the lotto gets as popular as this last one did, someone who buys the ticket is not just playing against a random number generator. They are also playing against everyone else who bought a ticket. This is, of course, because as more tickets are bought, the probability that many players purchase a winning ticket increases. If this happens, the winners split jackpot and each buyers' share is smaller.
Splitting Risk
A pretty simple analysis can show this phenomena. The graphic below shows the probability of multiple winners for a 1 in 292,201,338 lottery, with larger and larger number of trials (the extra tickets bought) along this x-axis. It's simply showing the probability mass functions of binomial distributions with different parameters.
Somewhere around 350 million tickets sold, 2 or more winners becomes more likely than no winners. Around 400 million tickets sold, this becomes the most likely outcome. As of the date I wrote this, I was not able to find how many tickets were actually sold forthe January 13 Powerball. But, prior to the lotto, 538 predicted anywhere between 500 million and 1.2 billion tickets would be sold. I also found that in Texas alone, approximately 60 million tickets were sold. So splitting the jackpot is a real concern— or opportunity.
I call it an opportunity for one simple reason: once people are involved, certain biases and behaviors may come into play. Implicit in the graph above is an assumption that each ticket is identical and independently distributed (iid). Essentially, this means everyone is randomly choosing numbers. However, imagine you knew for a fact, that everyone who bought a lotto ticket would choose the numbers 1,2,3,4,5,6. Then, the only way you could split the jackpot would be if you also chose 1,2,3,4,5,6. But, because every combination is equally likely to win, why not just by any other ticket? You'd have the same probability of winning, and no chance of splitting the winnings.
Obviously, the example above is an extreme case. Not everyone will be picking the same number. But, people are probably biased in one way or another. Anecdotally, people pick birthdays for lotto numbers. If thats true, people would pick numbers between 1 and 12 very frequently and between 1 and 31 somewhat more frequently than other numbers. Also, experiments have shown that people tend to pick numbers with 7 frequently when thinking of "random" numbers, Maybe people who try to randomize themselves would frequently pick seven. People may avoid 13, because it is "unlucky." If these biases show up in lottery numbers, it would make sense to purchase tickets that avoid these numbers.
An Empirical Approach
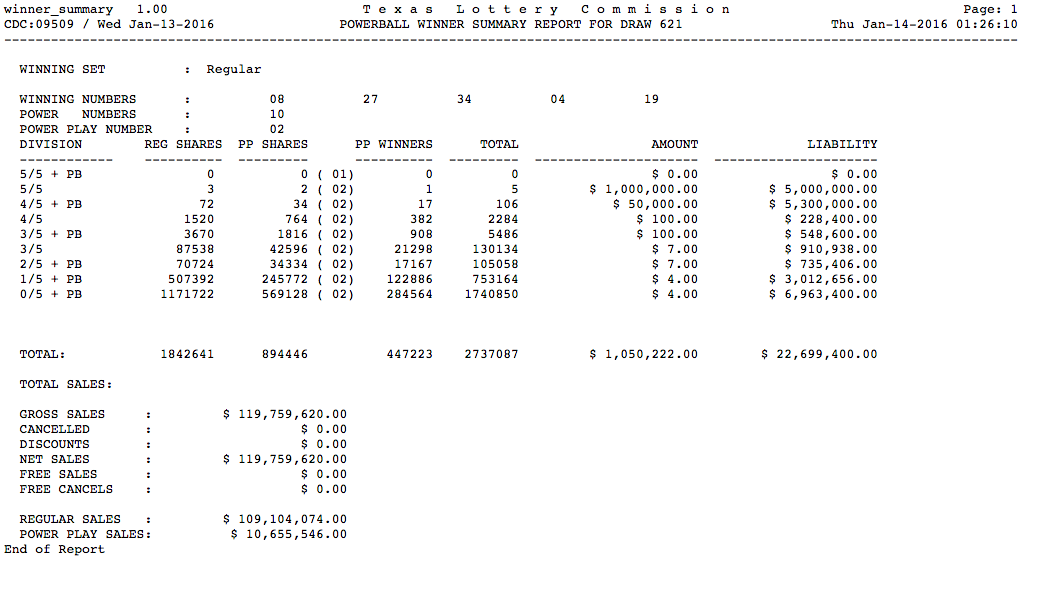
Now, I am sure that I am not the first person to think of this. This post would be pretty boring if I just left it there. But nope, I decided to spend my precious 3-day weekend actually figuring which numbers Powerball players most frequently purchase.This would have been really easy if I could just look at some database of tickets sold. To my knowledge, such a database doesn't exist for the general public, oo I needed an alternate approach. I realized every time there is a Powerball drawing, we get to see the numbers and we get to see if anyone won the lotto. I started digging and found that Texas Lottery Commission releases these nice little reports about each Powerball Lotto. In the report for each lotto, shown below, I can see not only whether or not anyone on the jackpot, but all of the lesser prizes given out when an ticket has some but not all of the numbers.
At this point, it's probably worth explaining how the Powerball works. A player chooses 5 numbers between 1 and 69 and one Powerball number between 1 and 26. To win the jackpot, you need to get all 6 correct. This scheme is relatively new; prior to October 2015, players chose 5 numbers between 1 and 59 and one Powerball number between 1 and 35. The rule changes would mean different distributions of numbers. So it's time for my first big caveat. To get more data, I focus on the earlier Powerball numbers. This approach will allow to observe whether people favor birthdays, numbers with seven, and ignore 13. But, it won't give me the ability to measure the exact distribution with with which people are picking numbers now. Also, I just focus on the 5 regular numbers and ignore the Powerball for roughly for the same reason. I looked at all the Powerball lotteries between January 1 2012, and October 2015.
My idea was simple. If someone wins the jackpot, I know exactly which 5 numbers they chose. Let's say I look at a lotto where the numbers 1,5,7,14, 27 were drawn.* If I see one jackpot ticket then I know, for a fact, one person chose each of those numbers. I can count that as one time I saw each number drawn. I figure that if I see someone get 4 out of the 5 numbers correct, I can say there was an 80 percent chance they chose the number 1, an 80 percent chance they chose 5, and so on. So I can count that as 4/5's of a time I saw that number. If I do the same for 3/5, 2/5 and 1/5, I should be able to calculate an "expected" number of times I observed some on picking the number. So, all I needed to was parse that report I showed above, and count according to the scheme above. I show this below.

When I looked at this graph and it made almost no sense, I realized something. I initially expected to see each number to be chosen as winning numbers an equal number of times. But actually, that would only be true if I had an infinite number of lotteries to observe. With a few hundred, I would expect some noise; my approach needs to control for that. I looked at which numbers were most frequently appearing in the jackpot. Sure enough, there is a pretty big range of numbers I observe, between roughly 20 and 45 times.

Then I realized, the situation is even worse. Different number of tickets were purchased for each lotto as people buy more tickets as the jackpot gets bigger. If I look at the number of tickets sold for lottos with each number in the jackpot, it looks like this (where the blue line represents the average). The least common jackpot numbers had less than 1/3 of the sales of the most common numbers. And of course, the distribution of these tickets, shown below, has a very similar pattern to the expected counts, a couple graphs prior.

So, I normalized my expected count of tickets observed by the number of tickets sold for lottos containing that number. This is calculation represents percentage of tickets that won a prize and contained a given number, of all tickets sold for lottos with these winning numbers. But, thats a mouthful, so I'll just call it my popularity index. And sure enough, a pattern emerged. As Monica Rogati, a prominent data scientist once described to me when I was an Insight Data Science Fellow, division is one of the most power algorithms.

7 is the most popular number, as I suggested it might be earlier. Also, it seems like there might be something to the date thing; no numbers between 1 an 12 drop below the blue line (which is what I would expect to see if everyone was purely randomly choosing numbers that were iid). And in general, numbers below 31 tend to be more popular than those after, although it's certainly noisy. On the hand hand there is no signal for the number 13. Also poking a whole in the date theory: 31 doesn't appear to be any less popular than 30, even though 31 should be an important date about half as often. Also, numbers containing 7, such as 17 are note more populated
After I did all this hard work, I found a blogpost on a website called Understanding Uncertainty. They did an analysis on a different lottery, only looking at jackpot winners. They found a similar date trend, but also found a spike at 17 and a dip at 13.
Lottery Uncertainty
There is one thing about this last graph that I feel pretty terrible about. I am presenting my estimated popularity but don't illustrate the uncertainty around these estimates. Some statistical noise comes from the fact that I am looking at a few hundred lotteries. These are only a subset of all the lottos which did take place, and also only represent a sample of all lotteries that could take place. Like I said before, if there were an infinite number of lotteries, we would expected to see the numbers drawn with approximately equal frequency. Because that didn't happen, there is some amount of error on my estimate. Second, when I observe an 80% chance someone picked a number, I count it as just that. But, that is not actually what happened. Either someone picked the number or they didn't. Instead of counting it as 4/5's of an observed pick, I could think about doing this analysis many times, where in 80 percent of them they chose the number and in 20 percent they did not. If I did that, each time I would get a slightly different estimate. This would create a distribution of estimated popularity, not just a sing point.Because of these two very different sources of uncertainty, the only way I could think of calculating the error bars would be to simulate analysis over and over again, with different samples of the lotto and different counts, in a process called a monte-carlo simulation.** But, that that would require much longer computation times, so I didn't have time to bother.
But I want to demonstrate why it's actually a big problem. Lets say and I did these simulations showed the same graph, but now also showed you a confidence interval (the range in which 95% of the simulations fell). Look closely, you can see little error bars on the graph. If it looked something like this, we might be reasonably confident that my estimates are correct. All the simulations would have created virtually the same result.


Also, there is one other flaw in my logic worth considering. Maybe you caught it. I am testing the hypothesis that people choose some numbers more frequently than others. Let's say I see a a jackpot of 1,7,8,29,48. For the ticket that got 4 out 5 correct, I said there is an 80 percent chance they chose each of those numbers. But, from my analysis, I saw that 7 is far more popular than 48. So why should I assume an equal chance this person chose those numbers? Now that I have more information, I should do better by assuming this person was also more likely to choose 7. So really, I should be iterating through the analysis, using the uniform distribution a first-guess prior, but updating with new information. I could keep cycling through until it converges. Now, thats a lot more work; I didn't do it.***
What would I do with this?
All that said, I were going to play the lotto again, I would probably use this data, even though I just described some of the empirical problems. This data roughly matches some of my expectations and is actually based on some data. As imperfect as it is, this data still seems better than randomly choosing numbers. Of course, if I was going to play the lotto for a business, I would make sure I got this right and follow through on the steps I described above. Of course, if I was going to play the lotto for a business, I'd be kicked out of my apartment and updating my resume, so I shouldn't dwell on it too much.But, I am not quite sure how I would use this data yet. One way to use it would be to randomly draw numbers with weights inversely proportional with the popularity. That way, I would choose 7 less frequently, and more of my tickets would be on lotto tickets with less played numbers. I could also take that to the extreme. Why should I ever play a Powerball where I choose 7? Why not just exclude the most common numbers completely? I would love to hear all of your thoughts on the optimal way to use this information.
Of course, this all moot. The optimal lotto strategy is to not play! I could have saved myself a lot of work if I remembered that sooner.
*1,7 is my birthday 5,27 is my wife's, and 14 is the day of the month of our anniversary. Now, if I ever forget these, I can just check my blog
** If you can think of a close form solution to deal with these two sources of statistical error, let me know
*** There is a reason I write blog posts, and not journal articles now...
Hey Evan, if you do decide to play again, I suggest playing the super lotto. The ticket costs $1 and the odds are 42 million to one, so the chance per dollar is more than 14 times higher then the powerball. Wait until the jackpot reaches $40 million or so, which happens sometimes. Because the headline number is not as high, very few people play, so the odds of splitting the pot is very small. Besides, you said in a previous post that your utility curve is basically flat at that point. ;) Bruno
ReplyDeleteHahahaha, thanks Bruno. I suspect my lotto days are over. This is a deeper dive than I ever expected
Delete