Sunday, March 5, 2017

Measured Action

In the wake of the Trump's election, I have been trying to figure out how to be an effective advocate for the issues I care about and the values of I believe in. I vowed to be more civilly engaged an prioritize acting over assurance the value of action. Without getting into exactly what I have been doing, I have taken to heart what former Obama speechwriter John Farvreau recently described as "protest is the new brunch." 

All that said, I do want to figure out what actions would be the best use of my time. Like any good policy wonk and data nerd, I turned to empirical research to identify which actions can have an impact.  I found* a great paper on this very subject: "Do Political Protests Matter? Evidence from the Tea Party Movement" by Andreas Madestam, Daniel Shoag, Stan Veuger, and David Yanagizawa-Drott, published the Quaterly Journal of Economics.

In this paper, the authors attempt to identify whether showing up at a protest is going to have any political impact. 

Because protests and political outcomes may be correlated through some latent variable, identifying such a causal impact can be difficult. Regions with large protests are likely to have election results consistent with the political leanings of those protests. I live in Oakland and near Berkeley; I see protests all the time. Liberal stalwart Barbara Lee represents my district. That doesn't mean the protests push her to be liberal. It is pretty likely that my district just has many liberal-minded people living in it. Whatever made us liberal and made us decide to live in this district, may be the very thing that causes us to vote for liberal representatives and to show up at protests. Barbara Lee would likely be my representative and would stand up for progressive causes, whether or not there we protests. 

So the question is, does my showing up at a protest have any impact on broader policy? This is hard to figure out. It's not like we can just run an experiment, where we randomly decide which congressional districts have a protest and which don't and then observe what happens.  The authors of this paper identified something almost as good. They realized different districts would have different weather on protest days, and the weather could effect the size of the protest. Because rain in specific location on a specific day is relatively random, they could use the variation caused by weather to measure the impact of protests on politics.

On April 15 2009, the Tea-Party planned and organized large Tax-Day protests, not unlike the Women's Marches on the Saturday following inauguration day. So essentially, the authors were asking "did rain on the day of the protest effect who got elected a year and a half later ?" They also looked at other outcomes, like how representatives voted in congress in years following the protest. The result they got was a pretty strong "Yes." Furthermore, it seems extremely reasonable to believe the only way rain on that specific day would affect outcomes is through the protests.

The authors state:
... we find that the weather-driven exogenous variation in rally attendance on Tax Day 2009 affected the eventual impact of these rallies. Where it did not rain, the number of local Tea Party activists was larger than where it did. Grassroots organizing increased, as did contributions to associated PACs and attendance at subsequent rallies. The population at large adopted the conservative-libertarian views of the protesters, and voter mobilization rose. This then led to more conservative voting both in the 2010 midterm elections and in the U.S. House of Representatives, and encouraged Democrat incumbents to retire.
Specifically, they find  that "for every protester, Republican votes increased by seven to fourteen votes." That's pretty powerful.

They don't believe showing up the protest is sufficient. By measuring attendance at future rallies, donations to conservative groups, and press coverage, they are actually arguing that these protests likely set off a pathway of events which eventually lead to the political outcomes. If you miss a protest, but make a donation you may have the same impact as if you did after showing up at the protest. But, a larger protest makes it more likely you donated in the first place.

While the authors create estimates for the change number of votes (and other outcomes) for each protest, they admit that this requires a strong assumption: the only causal mechanism between weather and the outcomes is attendance. They are pretty clear the only way the would expect weather on a specific day to influence outcomes is through the rally, but other elements about rally can be affected by the rain. Maybe less press shows up, or maybe people have a better time in good weather causing them to be more likely to return to the next one. The authors have no strategy to separate the impact of attendance from press coverage from quality of the experience. 

The authors also do some interesting tests to make sure this is not a spurious correlation.  The most interesting was looking at variation in weather on other days. They look back nearly 20 years, and find all days where at least 10% of districts had rain (representing enough variation to run the experiment). This provided a sample of over 100 days that had no particular political significance to see if rain had an  effect on elections: testing a placebo. Unsurprisingly, the effect on April 15 was often near edge of the distribution, suggesting that it is unlikely that by random chance that this  particular day was significant. However, it also demonstrated that there were a small number other days where rain was more impactful, even though there was no theoretical reason to think it would be. But hey, thats statistics.

Finally, the authors present a therotical model for the impact of  protests. They suggest to mechanisms that protests can influence politicians: persuasion and information. Persuasion is about applying political pressure to move to change their positions. Information is about letting them know how the electorate stands. The authors conclude that if information was the driving mechanism, the effect of the rallys would decrease over time, when the empirical evidence shows the opposite. This suggests that protests can pursuade politicians to change their behavior. 

Overall I found the paper both clever and persuasive that protests matter. Simultaneously, there is no evidence that protests are either sufficient or necessary. If an individual would be politically involved by donating money or in an organization, regardless of weather or not they went to a protest, this does not prove that they should have. Similarly, going to a protest, but not being involved afterwards may not change votes. All this paper proves is that going to a protest is part of a causal path to influencing electoral outcomes. 

So I'll keep on doing all the things. And while its unclear the Women's March will have the same result as the beginning of the Tea-Party, I look forward to reading the research that lets us know


*recommended through the Linear Digressions podcast

Monday, February 20, 2017

Bayes Area

tl;dr: Bayesian Basketball Dashboard here.

One of the themes of my career to this point, from my doctoral research to being a data scientist in industry, to writing this very blog, is the interaction between substantive expertise and quantitative analysis. In some disciplines such as scientific research, these areas two domains are inextricably linked; a scientist with domain expertise proposes a model or hypothesis for how some phenomena works, and then uses data to confirm or reject the hypothesis. In other disciplines, there has been a tension between the two. For example, Nate Silver describes a conflict between traditional political pundits and his form of data journalism.

If you know me, its no surprise that I care deeply about data. I even feel silly writing that sentence. It seems obvious. Ever since I wrote a senior thesis in college where I analyzed auction prices for sulfur dioxide permits, I have loved getting my hands on data and learning from it. But it also seems like an empty sentence; data is everywhere and people use it in countless ways. To say that you care about data 2017 feels like saying a fish cares about water.

What I think others would find a little surprising is my willingness to overlook or go beyond data and trust human expertise. Just because I have numbers stored somewhere doesn't mean I have evidence. Obviously, data can be misleading or biased in someway. But what I believe is that in the absence of good data, people can be (in the right contexts) very good at integrating various pieces of qualitative and quantitative information and forming judgements.

Sunday, July 31, 2016

Research Matters

One of my first blog posts was about the fantastic book Between the World and Me, by Ta-Nehisi Coates. At that time, I said I was looking forward to writing about some academic research about racism and the use of force by police officers. As with many things in the blog, it took a while. In this case, it wasn't for lack of trying. Over the last six months, I found myself returning over and over again to google scholar, but was unable to find any compelling research in this area.

Then, the exact week that officer involved shootings became a major news story again, with two high-profile incidents, rallies across country, and then a shooting against police officers, a relatively high profile piece of economic research came out. A working paper, The Empirical Analysis of Racial Differences in the Police Use of Force by Roland G. Fryer, Jr  was posted on the website of the National Bureau of Economic Research (NBER). The paper examines whether African Americans, and other minority groups experience disproportionate amounts of force, after being stopped or encountered by the police.


Sunday, July 24, 2016

Hadoop... There It Is (Part 2)

Well, at long last, I have completed my Hadoop Raspberry Cluster. It took a couple of months to dive back into this project. I have my own personal cloud, running similar technology that power some of the worlds most important tech companies. However, my cloud is pretty lame. It less powerful than the MacBook Air that I am currently writing this post on. But, at least it's complete and time to write about it!


Saturday, May 21, 2016

Analyze That: Data Journalism and Trump

In the last week or so, I have encountered lot of discussion about the failure of data journalists (mostly the good folks at fivethirtyeight.com) to predict Trump's nomination to the Republican Ticket. In fact, that's understating it a little bit, they were quite confident that Trump would not be elected - famously Nate Silver put his chances of winning around 2 percent. In a recent podcast and 538 article, Nate Silver did some interesting post-mortem on the analysis. In part, he critiques his own methods and in part chastises himself for issuing a subjective prediction that did not come from a computational model. For this, he states that in this particular instance, he acted like a pundit. He was too focused on his own priors and underestimated the uncertainty due to a small sample size of "Trump-like" candidates. At the same time, he does defend his use of empirical approaches.


Sunday, May 15, 2016

Analyze That

One of the things I often enjoy doing with my friends is thinking through some political, policy, economic, or business problem. Sometimes this an issue in the news, sometimes it's something that one of us recently read about or heard about on a podcast. Other times, it's some random topic that we happened to stumble onto over the course of a conversation. Either way, we generally just have a good time breaking such a problem down. We often jokingly refer to this as "consulting the shit" out of a problem. 

Tuesday, May 10, 2016

Neuroses

A few weeks ago I posted about the difference between machine learning and econometrics. Though I talked a lot about the applications of the two techniques, I tried to avoid getting very detailed about any of the algorithms involved. Recently, I've also been doing a deep dive on one of these machine-learning algorithms: Neural Networks.

About two years ago, I started hearing a lot about "deep learning" and a powerful algorithm called a neural network. These things seem to be everywhere: from Siri and to facial recognition. I must admit, somewhat embarrassingly, it took me quite some time to figure out what exactly a neural network was.

Everything that I read, when trying to understand the Neural Network, suffered from one of two problems. Some pieces just weren't that technical, and described the analogy of his algorithm to a human brain. They talked about things called "hidden layers" without telling me what was actually going on in them. The other type of post had a lot of math very quickly. It's not that I couldn't understand the math, but I wanted the high-level summary technical summary, knowing I would work through the math later. 

But, two things became very clear. First, these the "blackest box" of the machine learning algorithms we have. Everything about inference and decision-making in the last post does not apply when using the NNs. Second, they are really really powerful. They are extraordinarily good at addressing some of the toughest data science problems. Given their recent success, they aren't going anywhere.


So it was time to learn!

Friday, April 1, 2016

The Better Angels

A review of The Better Angels of Our Nature: Why Violence Has Declined by Steven Pinker

I recently finished reading The Better Angels of Our Nature: Why Violence Has Declined by Steven Pinker, after hearing Bill Gates recommend it on the Ezra Klein Show.* This book argues that one of the strongest and most important trends throughout human history is a massive decline in violence. Pinker compiles a large number of studies to argue that this trend actually exists and then turns to psychology, sociology, and evolutionary biology to better understand it.

Pinker is Harvard Professor in the Department of Psychology, and a brief look at his bio shows that his work reaches across fields. His book is no way an argument that there are no injustices left or that humanity has achieved some mission to remove violence. Instead, he is coming at this topic as a social scientist with an eye towards history. He observed a phenomenon, one that he argues is frequently overlooked, and tries to explain it.


Wednesday, March 16, 2016

A cool little thing I did

Ok, so this a very brief post about how the sausage gets made, but I need it to test what I am doing, and some of you nerds might actually want to do this too.

So its not really worth getting into all the details here, but I have been trying to figure out for a while how I can get interactive visualizations onto this blog. After all, if it's a data science blog, we need to be able to see the data in a fun informative way. Oh, the other caveat is, I am totally cheap and didn't want to pay for my blog to be hosted.


Sunday, March 13, 2016

Machine Inference

Hal Varian, the chief economist at Google, put together an awesome presentation about the differences and similarities between machine learning and econometrics. Varian clearly knows his stuff. Working at Google, he is privy to some of the foremost experts on machine-learning. And he no slouch when it comes to economics; he is the author of many students' favorite microeconomics textbook.

After getting a Ph.D in policy analysis where I studied a fair amount of econometrics, I started working as a data scientist using machine learning. Though I am not the same level expert that Varian is on the issue, I too have found myself talking about this a fair amount. So, at the risk of repeating much of the same subject matter, I decided I would write my take on it. My thoughts are a little less technical than Varian's, and are largely aligned with his presentation. By working through a real-ish example, I hope I can describe the risks of thinking addressing a topic that really requires econometrics with machine learning.


Sunday, January 31, 2016

Show Me a Power Broker

Review of Power Broker and Show Me A Hero

This summer I read an all time great book, The Power Broker: Robert Moses and the Fall of New York. Writing about this book was one of the first blog posts I envisioned when designing this blog. It was also a major upset when Power Broker did not top my list of books in 2015, but I suspect it will only rise in esteem over time. In my mind, I have also begun linking it with arguably my favorite piece of media that debuted in 2015: the HBO mini-series, Show Me A Hero. 

The Power Broker is a biography of Robert Moses, a historical figure I had previously never heard of, but now constantly see references to. Moses, the chief urban planner in New York City serving in various roles from 1920's to the 1960's, was a cross between Leslie Knope and J. Edgar Hoover. He began as a progressive reformer, writing legislation in New York State as an aide to Governor Al Smith. As part of his reformist agenda, he championed the creation of park space. This eventually transitioned him into the head of Long Island Park Commission, where he designed a masterpiece recreational development.


Monday, January 18, 2016

Balls Out

An analysis of  the frequency with which customers choose Powerball numbers

I told you that I got a little obsessed with the Powerball lotto last week, when I broke down the behavioral economics behind my decision to join an office pool. Well the obsession continued, as I searched for an optimal strategy for playing the lottery. Plus, writing about the Powerball again allows me pull out more "ball"-related double entendres.

Optimal strategy, isn't it a lottery? That's a reasonable question, as the whole lottery just comes down to picking some random numbers. But, when the lotto gets as popular as this last one did, someone who buys the ticket is not just playing against a random number generator. They are also playing against everyone else who bought a ticket. This is, of course, because as more tickets are bought, the probability that many players purchase a winning ticket increases. If this happens, the winners split jackpot and each buyers' share is smaller.

Tuesday, January 12, 2016

Power Ballin'

Behavioral Economics and the Largest Lottery

On Saturday, my neighbors handed me a lotto ticket as a birthday gift. Of course, this was no ordinary lottery ticket; the Powerball had reached the biggest pot ever at nearly one billion dollars. Later that night, I remembered that I had shoved the ticket in my pocket. I had fleeting a moment of joy, where all of a sudden the future seemed wide open. Anything was possible. 

Then, I checked the results. It turned out the only plausible thing occurred, I lost. So did everyone else, and pot for the next lotto increased to well over a billion dollars. Since that moment, I have been more than a little obsessed. 


Even understanding probability as I do, I found myself falling prey to many interesting behavioral phenomena.

Sunday, January 10, 2016

Hadoop... There it is (Part 1)

Adventures in building my own personal cloud

Around Silicon Valley, people talk a lot about Moore's Law, which observes that microprocessors double in power (for a constant cost) roughly every 18 months. This law has produced something else that Silicon Valley types talk a lot about: Big Data.

That's right, Big Data did not just pop out of nowhere. As computers have more cheaper and more powerful, the cost of storing data has dropped dramatically. When computers were slow and expensive, people and companies had to make choices about what data to save. Today, its probably more expensive to hire people to spend time thinking about what data to store than it would be to just throw it on a computer somewhere. 

Actually, that last sentence is not quite correct. As powerful a modern computers are, most are not quite big enough to handle Big Data. In fact, the term Big Data defines data that it are too big to store on a single computer. Instead, the data are stored on whole bunch of computers networked together, called a cluster. So I should have said, just throw the data on a bunch of computers somewhere.

Working as a data scientist,  I work on this type of cluster. But I have never actually seen or touched the computers!  In an effort to understand a little bit more about how they work, I decided to build my own personal Big Data computer cluster. 

Sunday, January 3, 2016

How I get to work

I know… what could be more self-indulgent and boring to readers than a post about my morning commutes? However, I find myself explaining my commute to tons of people, because it’s pretty interesting. I actually believe that my commute is an interesting example of policy at work. I would also love to find out if anyone has estimated the economic value of my commute. So bear with me, hopefully this is not as self-indulgent as it seems.


Thursday, December 31, 2015

Experimenting with Development Economics

A Review of Debunking the Stereotype of the Lazy Welfare Recipient: Evidence from Cash Transfer Programs World Wide


As I scrolled through Twitter a couple of months ago, I found a New York Times review of a recent economics paper that drew my interest. It caught my eye because the lead author is Abhijit Banerjee. Banerjee is all the co-author (with Esther Duflo) of what is probably my favorite economics book written for a general audience, Poor Economics: A Radical Rethinking of the Way to Fight Global Poverty.

I was not necessarily interested in the subject matter of this particular paper (though it turned out to be a fun read), as much I wanted excuse to write about Banerjee's work. But it's a been a while since read Poor Economics (and the other books I reference), so this seemed like a reasonable entry point. 

Monday, December 28, 2015

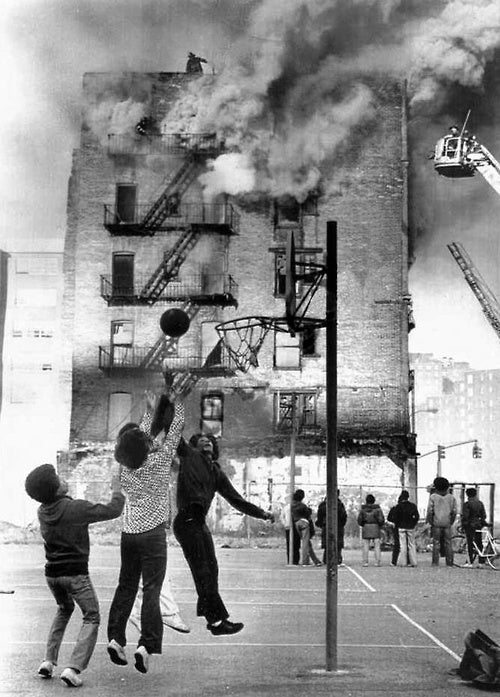
Lessons from a Burning Bronx

What the New York City Fire Epidemic Can Teach Today's Analysts: A Review of the "The Fires"


In 1977, The New York Yankees faced off against the Los Angeles Dodgers in the World Series. Before one of the games, a fire broke out near the stadium. Audiences seem to remember the announcer,  Howard Cosell saying "There it is, ladies and gentleman, the Bronx is burning" as the Yankees lost and camera panned upwards to show the lingering smoke. This phrase captured the essence of the game, and more importantly epidemic of fires in the city. It even became the title of a ESPN television show about the World Series. Never-mind that the actual footage of the game doesn't include this phrase. 


Though the quote may be apocryphal, there truly was an epidemic of fires throughout New York City in the 1970s. I was turned onto a fascinating history of these fires, listening to What's The Point, a podcast from fivethirtyeight.  This podcast contained a conversation with Joe Flood, author of The Fires How a Computer Formula, Big Ideas, and the Best of Intentions Burn Down New York City-- and Determined the Future of Cities.

This history, in part, involves data, complex analyses, and the RAND Corporation. This of course, was fascinating to me, as I went graduate school at the Pardee RAND Graduate School (for all practical purposes, part of RAND), so I read Flood's book. Flood's story of the fires reminded me of some prescient lessons, that in some form are relevant to many analysts and data scientists to.

Sunday, December 20, 2015

Stupid Data Tricks

A Markov-Chain Text Generator for Evanometrica

You will all have to excuse me, as it has been a little bit longer than I was expecting since my last post. First, I was traveling. Second, I found that it is a little more time intensive to generate high quality blog-posts than I initially assumed.

Being a data scientist and all, I figure I can just get the computer to do it for me! I decided to write an algorithm that can come up with headlines of blog-posts for me. It's an extremely simple Markov-Chain Model text generator, that leads to some entertaining results. This was fun, but accomplishes nothing of value, so it was a Stupid Data Trick.